Settings
Usage
See how many tokens your organization uses, day by day and member by member.
Settings → Usage, under Organization, shows how much model work your organization does. Owners, admins and billing admins see it.
It counts every model request your agents make, whatever pays for it: your own API keys and plans, organization models, and ArkenOS's own models. Only ArkenOS's own models spend credits; the rest bill through their provider. See Credits and grants.
When to use it
- A bill or credit balance looks high and you want to know which days and whose work drove it.
- Before a big run, to check how much this period has used already.
- Monthly reviews of how the lab's model use is growing.
To see what you're charged or buy credits, use Billing and Credits and grants. To change which models handle which work, and so the cost, use the Intelligent task router.
Why it matters
Model use is the largest running cost of agent research. Usage shows it by day and by person, so a spike from an eval sweep or a runaway goal is easy to spot and explain.
Token usage
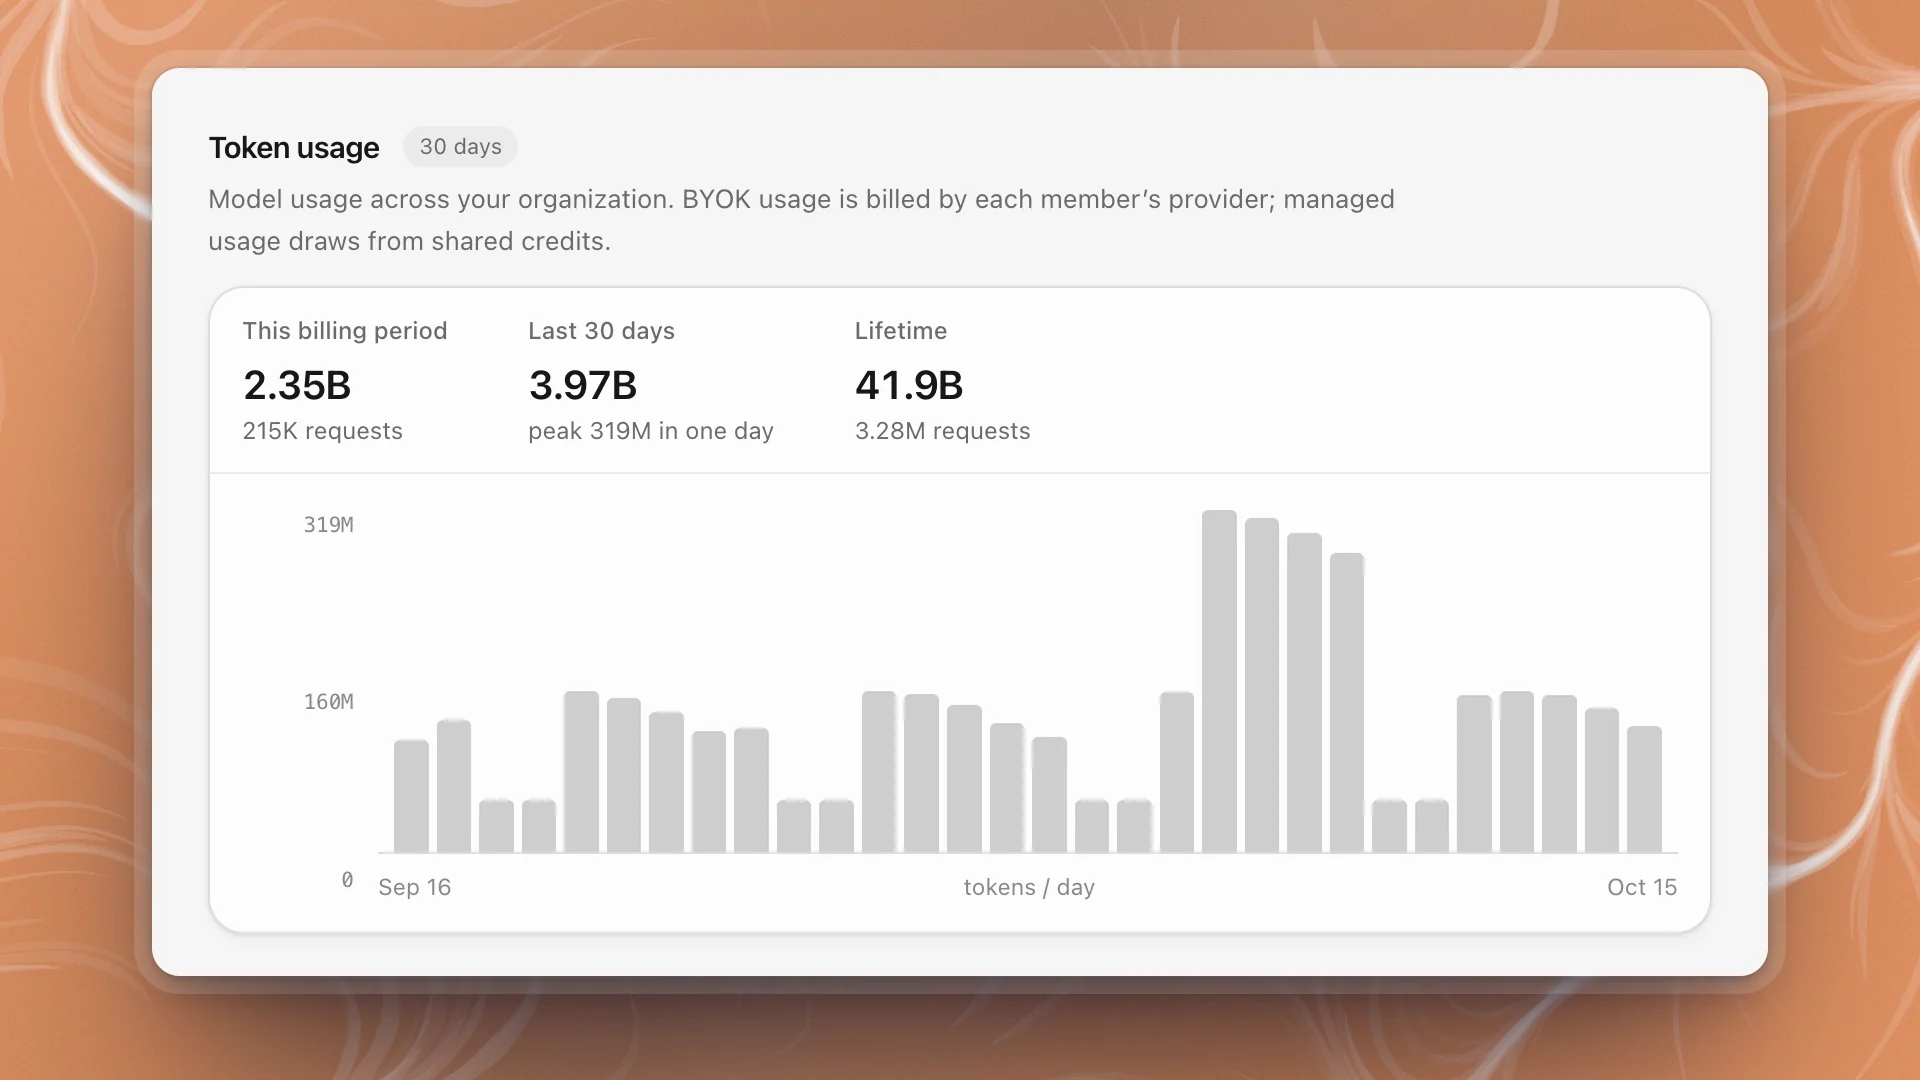
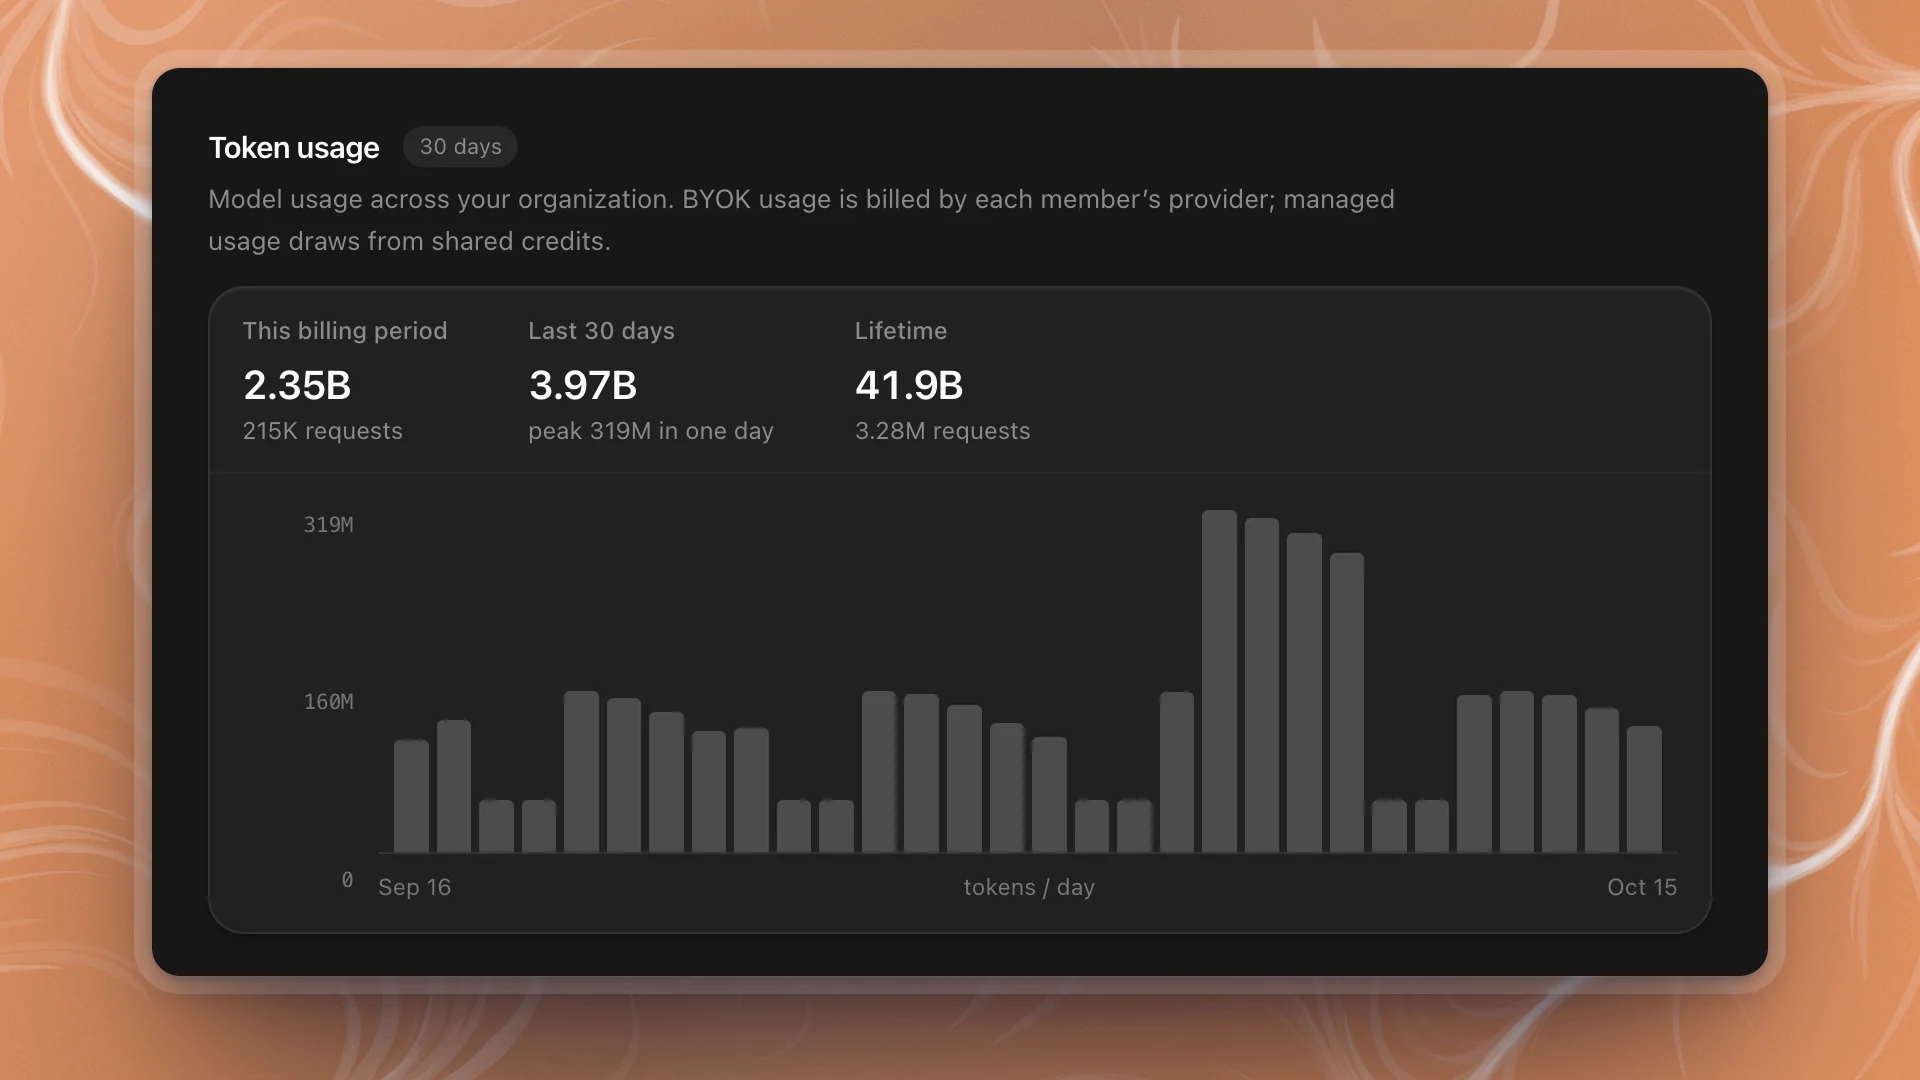
| Figure | Shows |
|---|---|
| This billing period | Tokens since the period started, and the number of requests |
| Last 30 days | Tokens over the chart's window, and the busiest single day |
| Lifetime | Everything since the organization started, and its requests |
The chart has one bar per day for the last 30 days. Hover a bar for that day's exact tokens and requests.
A busy research lab running fine-tunes, eval sweeps and long goals around the clock easily reaches billions of tokens a month. Most of that is usually input: agents re-read code, logs and earlier conversation at every step.
Usage by member
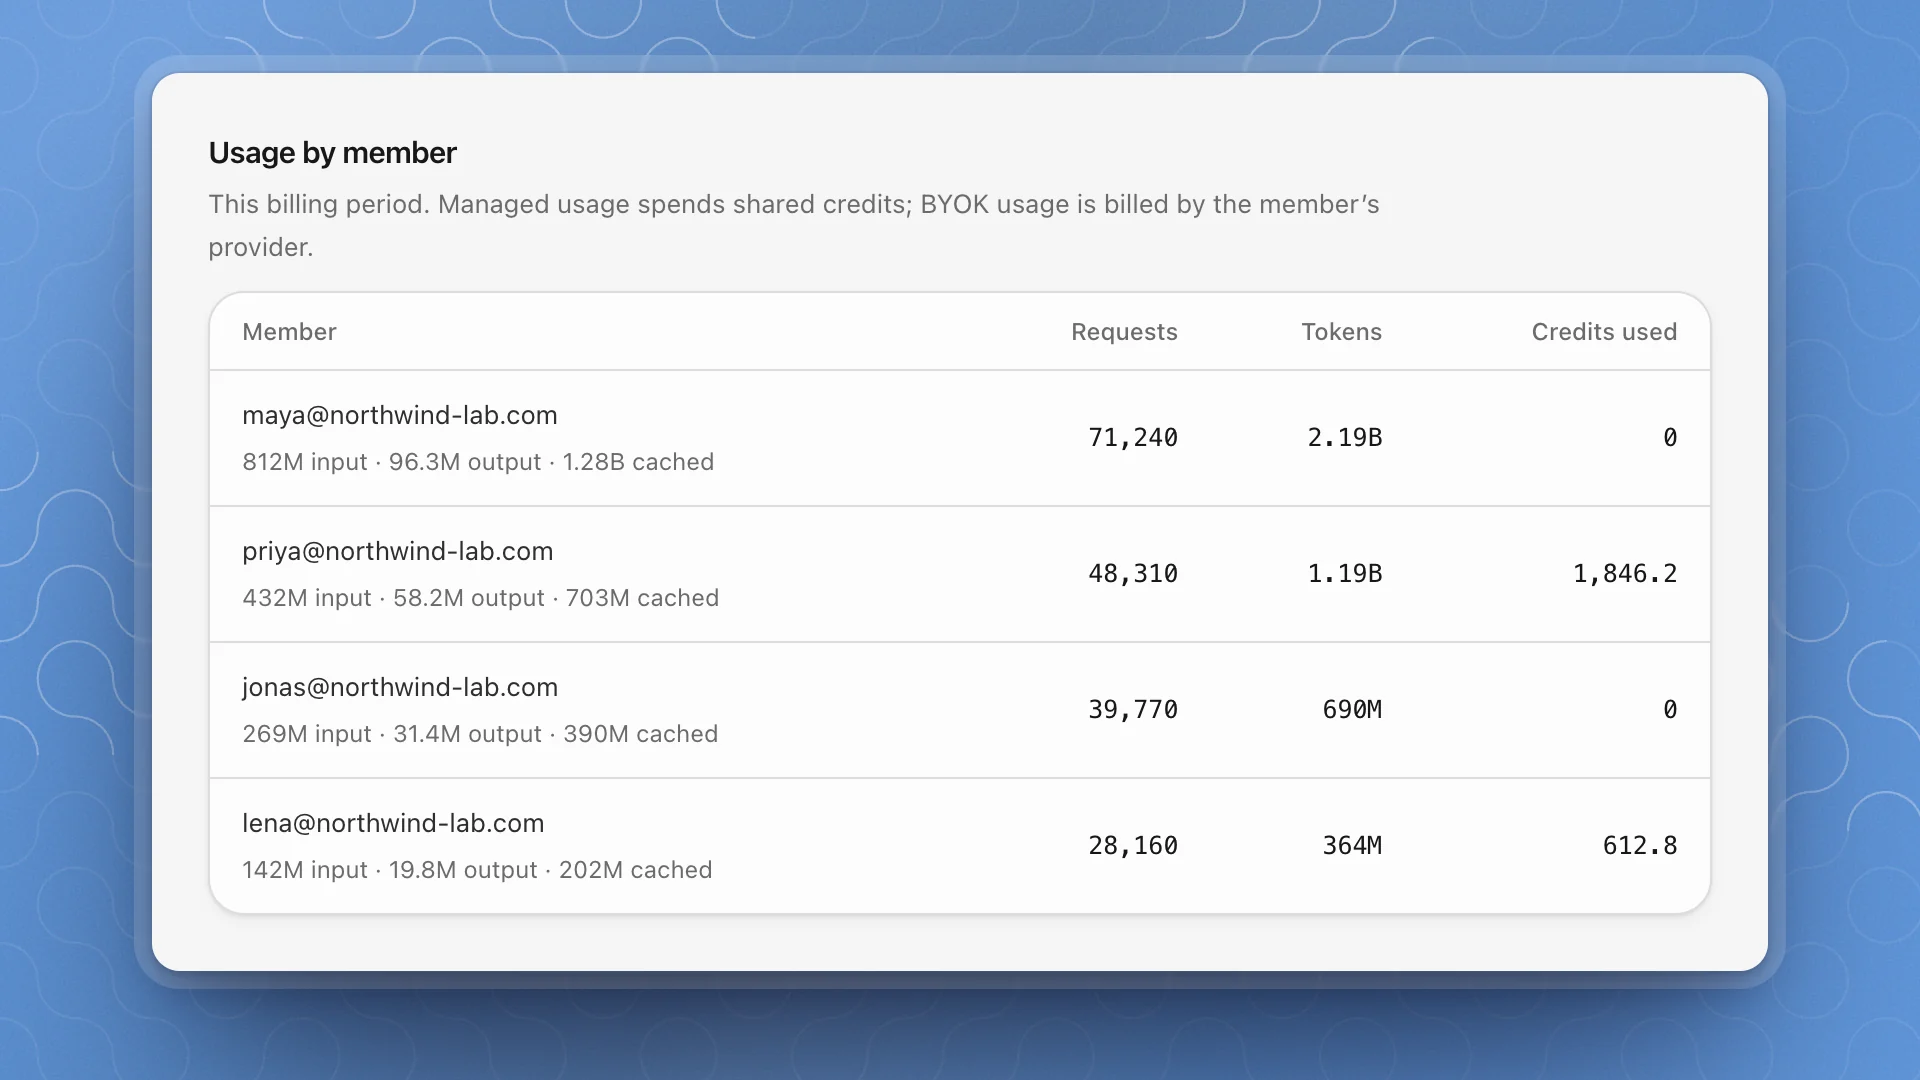
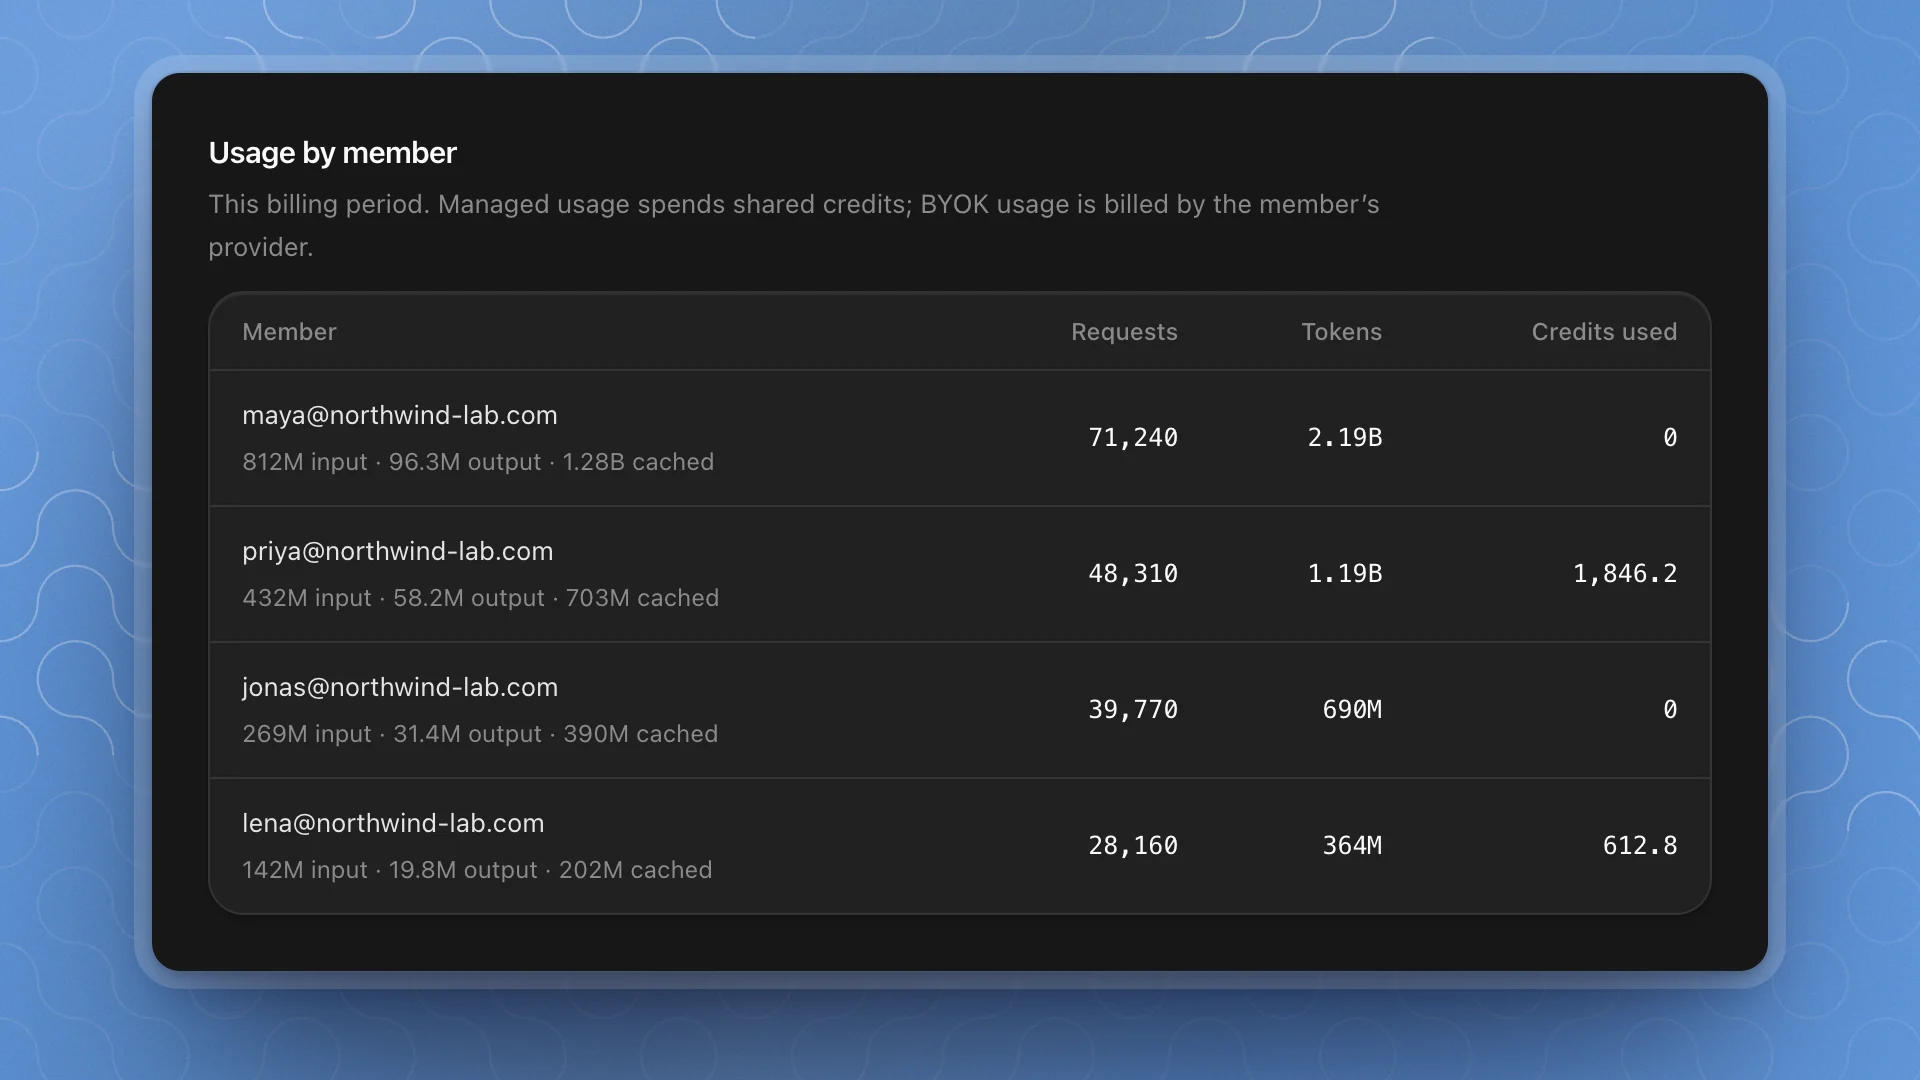
For each person this billing period:
| Column | Shows |
|---|---|
| Member | Their email, with input, output and cached tokens underneath. People who have left show Former member. |
| Requests | Model calls made for their work |
| Tokens | All tokens, in total |
| Credits used | Credits spent on ArkenOS's own models. Zero for work on someone's own key or plan. |
Reading it well
- Explain a spike by finding the tall bar, then checking who ran what in Usage by member.
- Watch the cached share. Cached tokens are context the provider has seen recently, and they usually cost much less. A high share on long goals is a good sign.
- Compare requests with tokens. Many requests with few tokens is quick back-and-forth; few requests with many tokens is agents reading large files or long histories, which a long-context tier handles best. See Intelligent task router.
- Check before a big run. Glance at this period's total before launching a week-long goal or a sweep across many seeds.
Related: Billing, Credits and grants.