Workspace
Workspace analytics
See how much work happened in a workspace, and how much of it agents did.
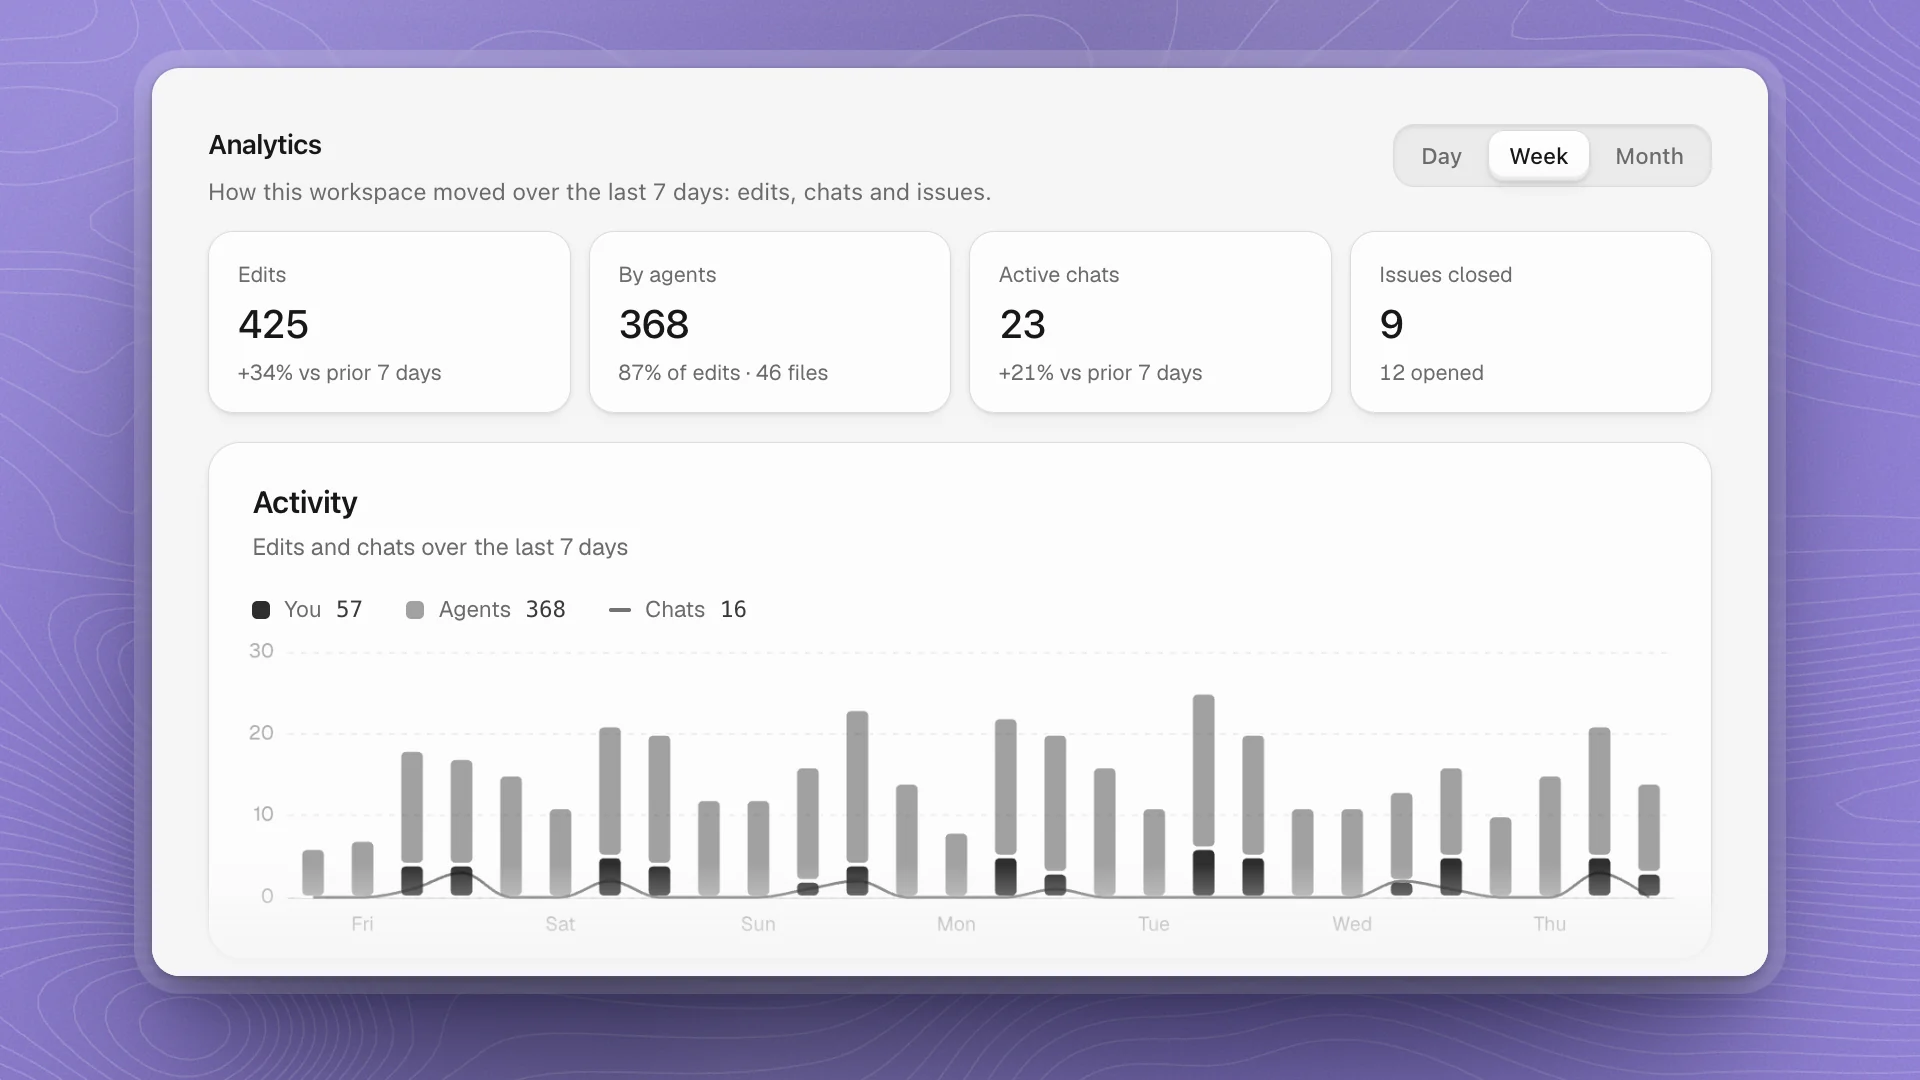
Analytics gives you a quick read on how a workspace is moving: how many changes landed, who made them, how many chats were active and how many issues closed. Use it to check that agents are carrying the load you expect, and to spot a project that has gone quiet.
When to look. At the end of a week, after handing a big job to agents, or when a project seems to have gone quiet.
Why it matters. It tells you whether agents are doing the share of the work you expected, without reading every chat.
Open it
Click Analytics in the sidebar, under Artifacts. It opens as its own tab. Pick Day, Week or Month at the top right. ArkenOS remembers your choice on this device.
The figures
| Figure | Counts | Below the number |
|---|---|---|
| Edits | Changes to pages and files that ArkenOS recorded in the range | Change against the range before |
| Files changed | How many different pages and files those edits touched | The share of edits that agents made |
| Active chats | Chats with activity in the range | Change against the range before |
| Issues closed | Issues finished in the range | How many were opened |
Day covers the last 24 hours, Week the last 7 days and Month the last 30.
Edits come from the workspace's edit record, the same one behind the “Edited …” stamp on a page. It records every change made through the editor and through agents' file tools. Files changed by shell commands, a training script writing checkpoints say, are left out, so treat the counts as a floor.
Activity
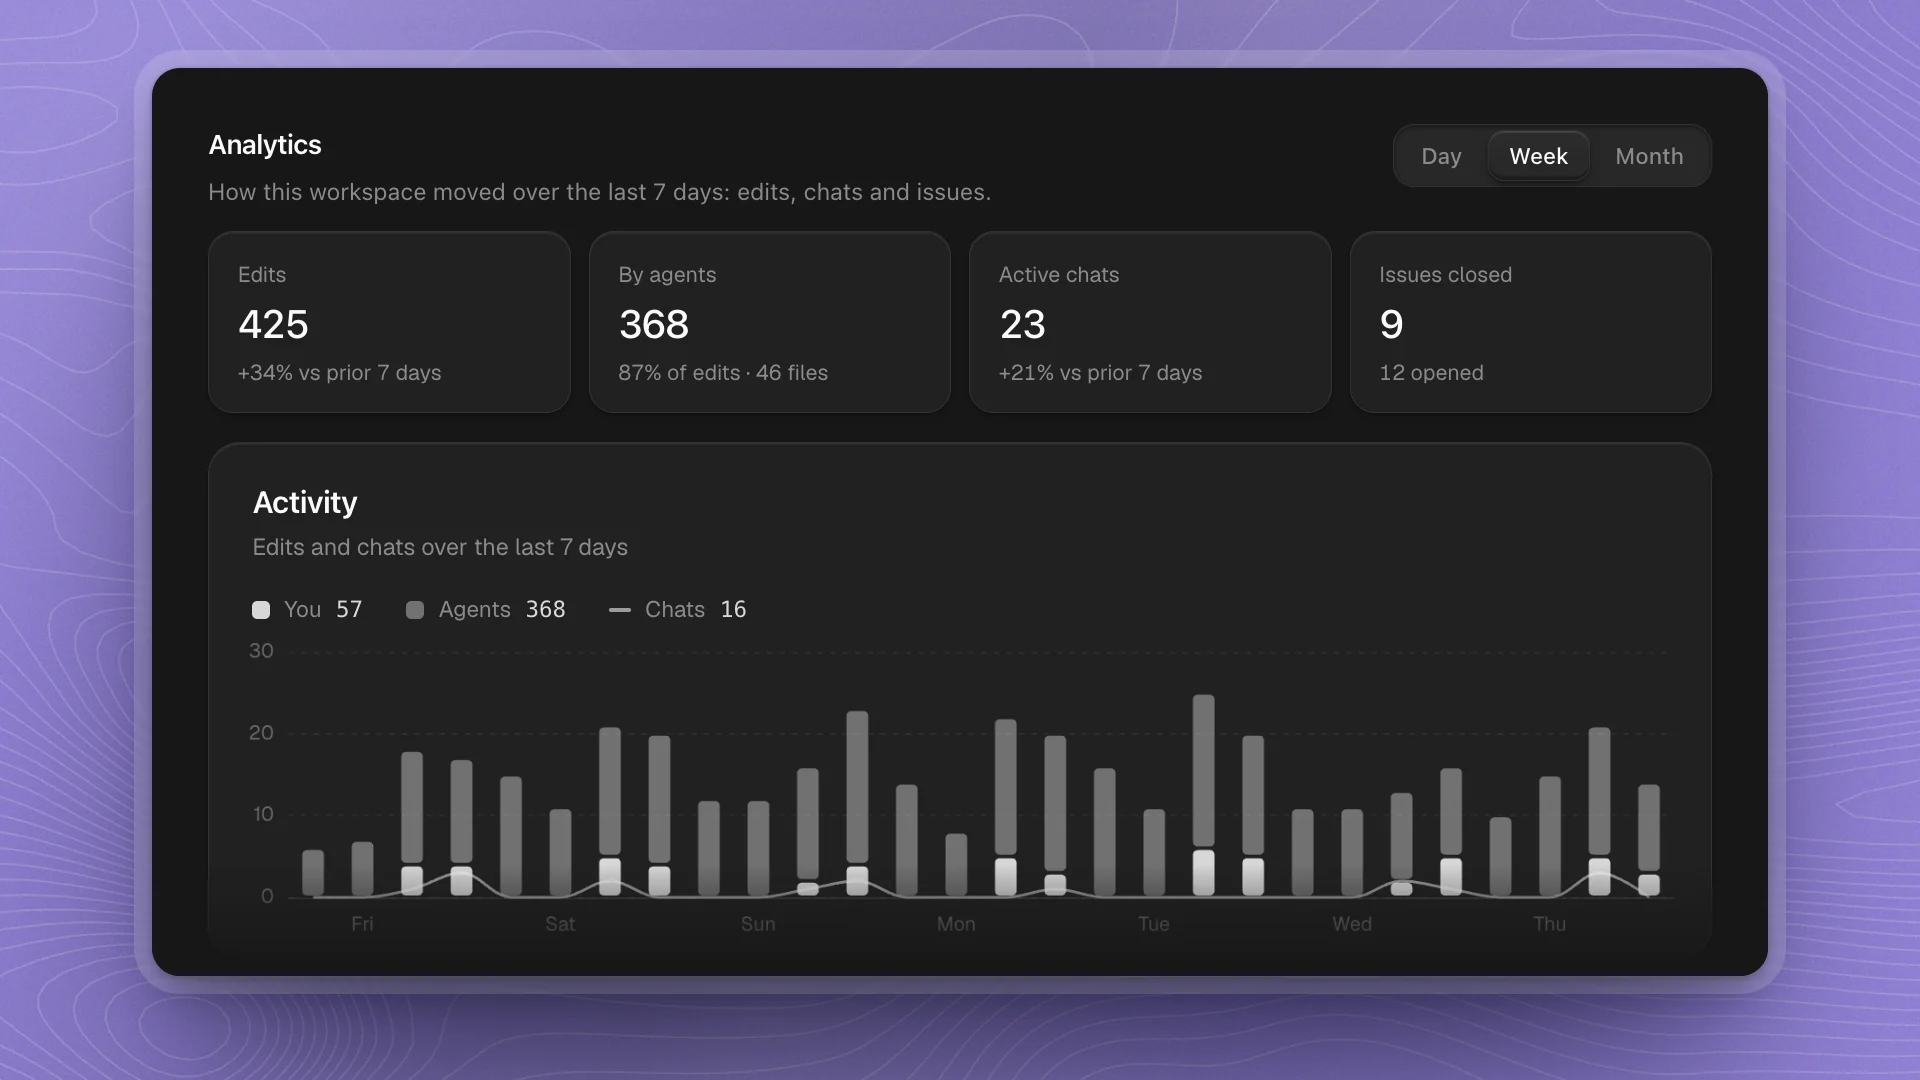
The Activity chart stacks your edits and agents' edits for each stretch of the range, with chats as a line across them. The key above it gives each total. Hover a bar to see its time and every count in it.
Who's building
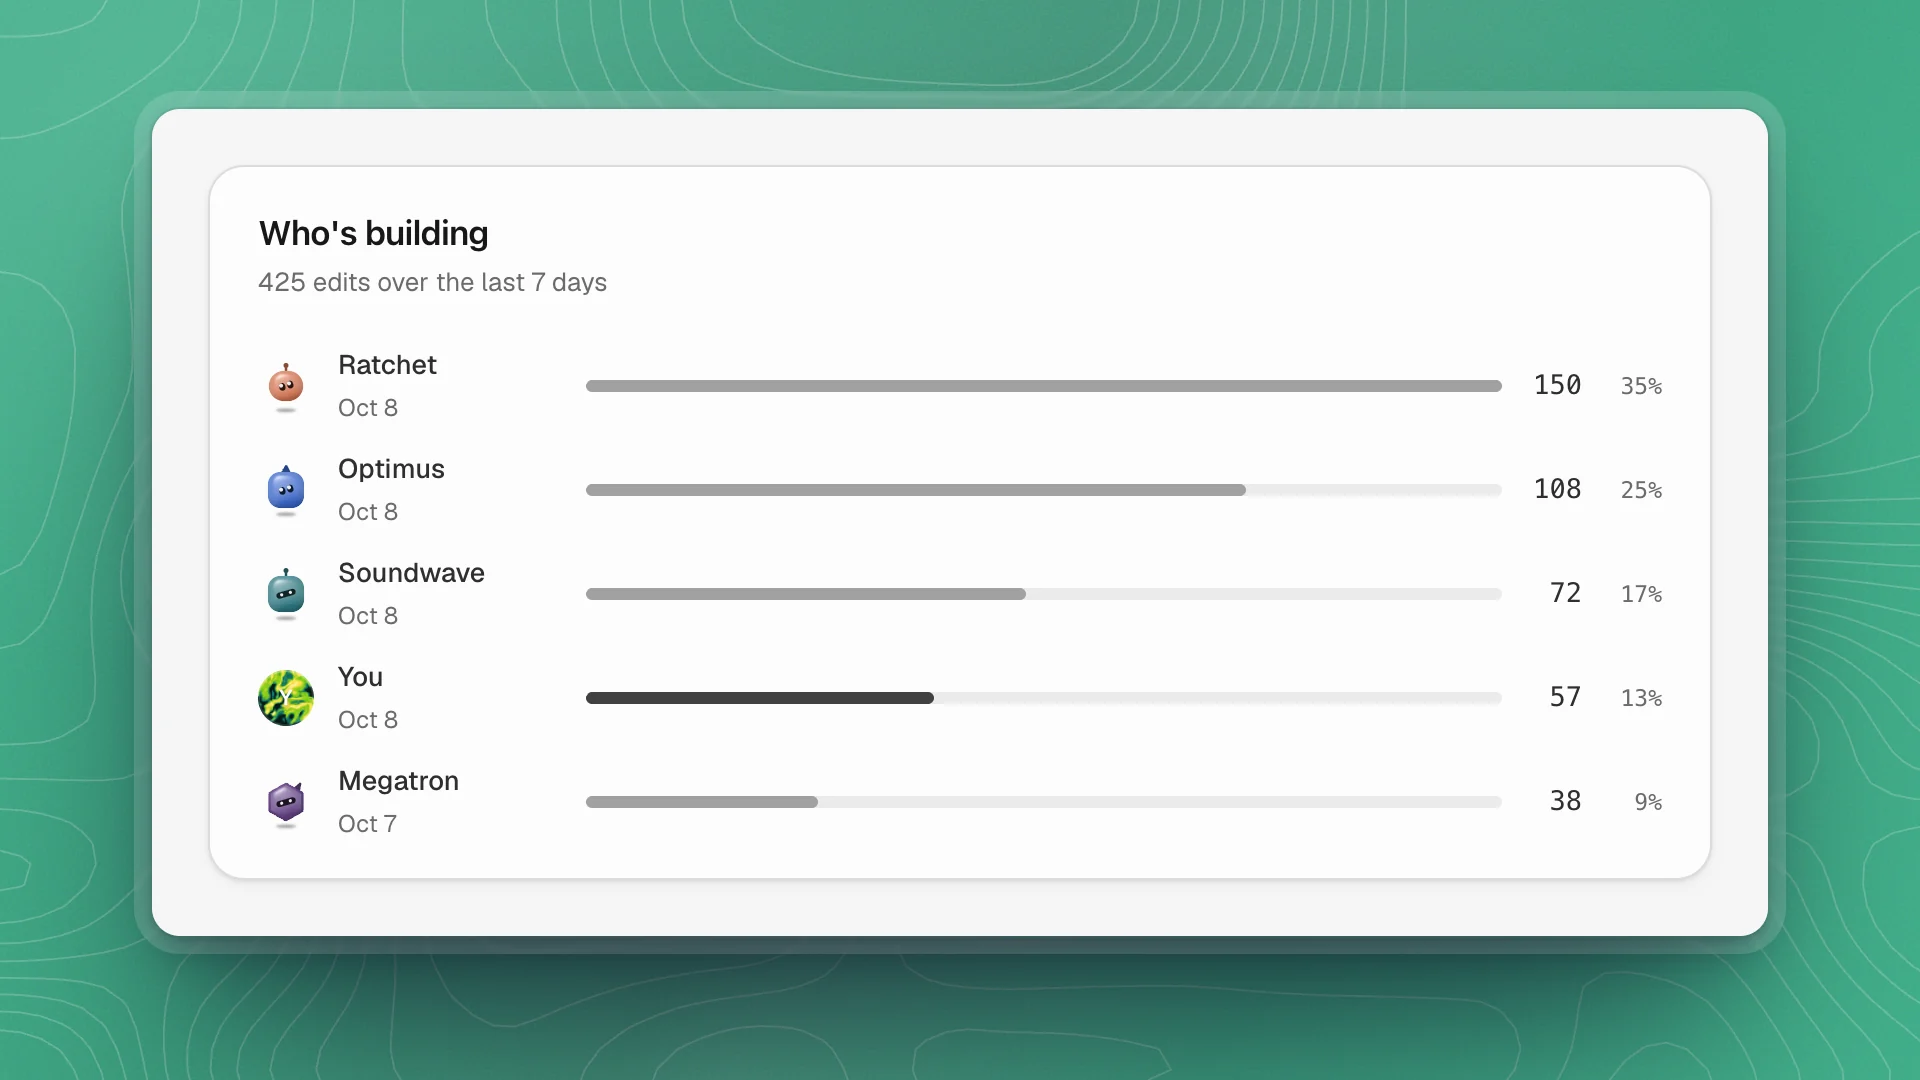
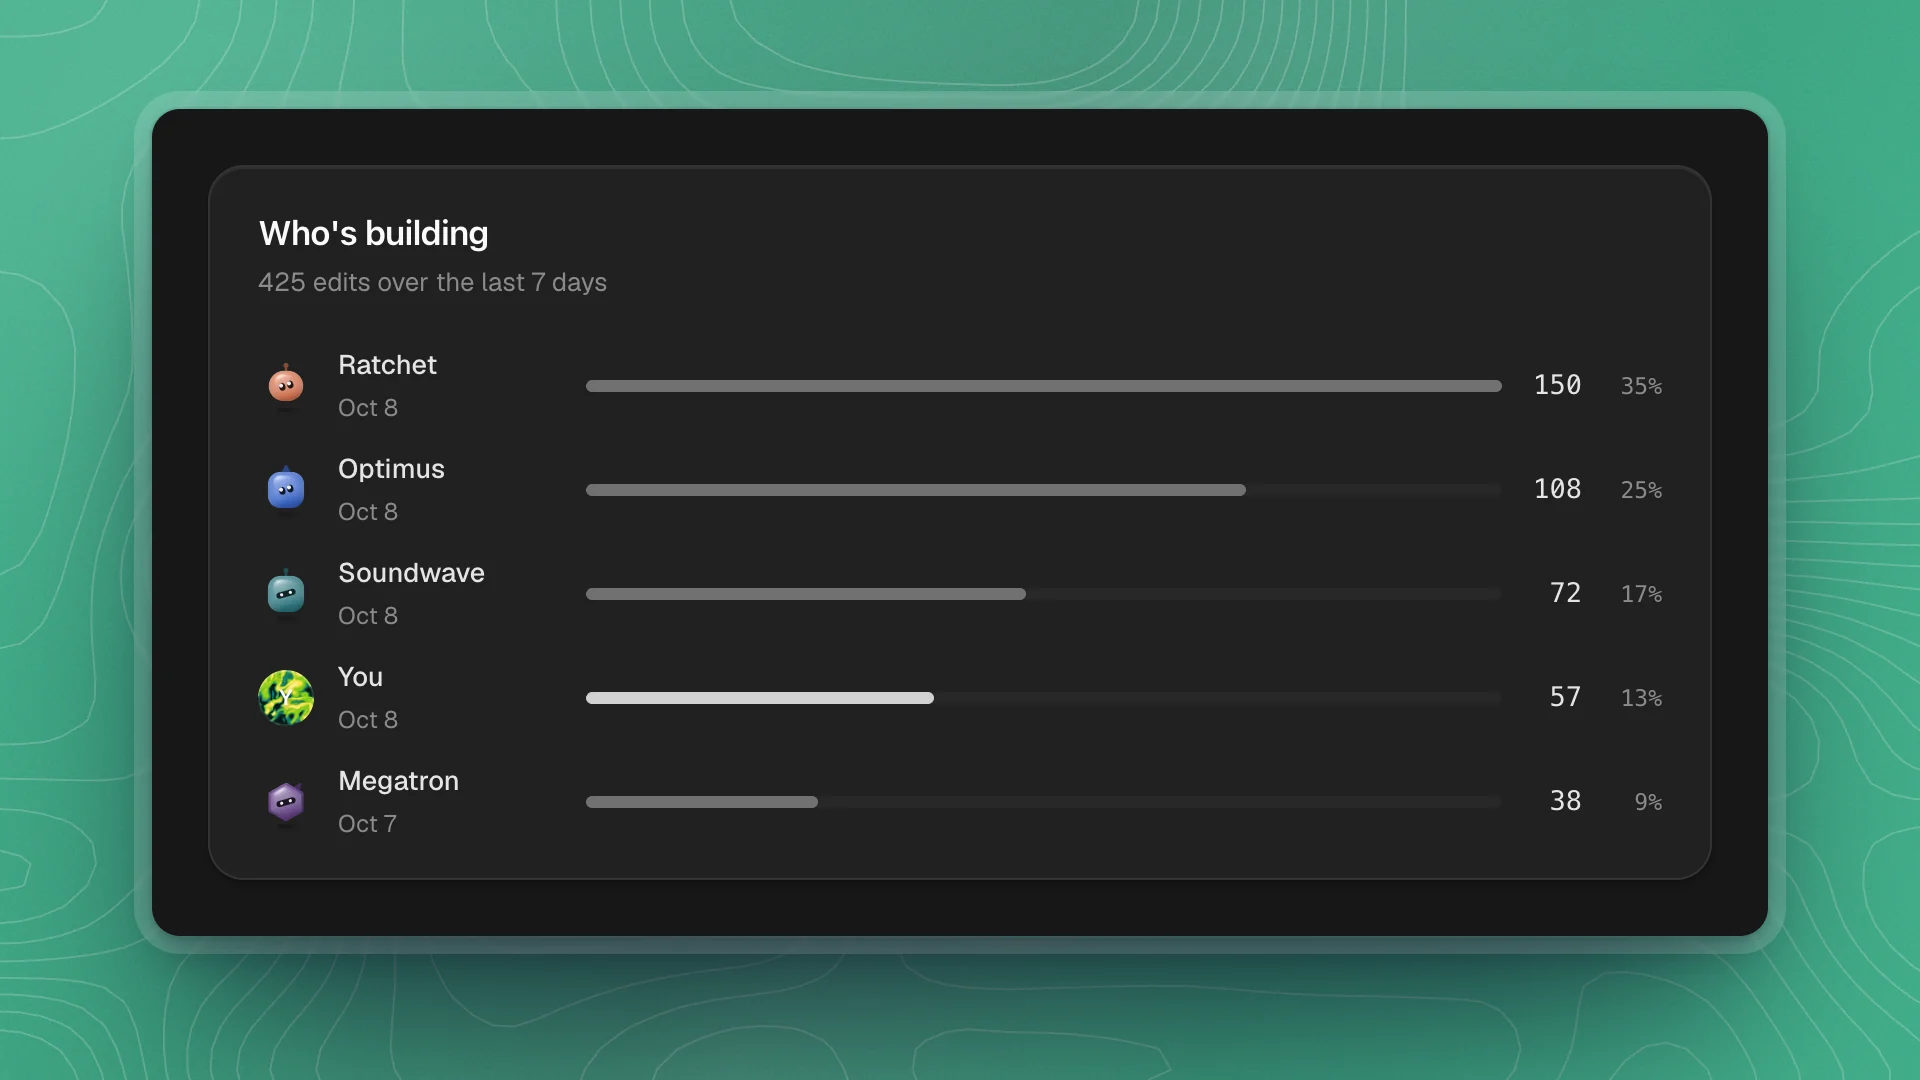
One row per person or agent who edited the workspace in the range, busiest first, with their edit count, share and when they last worked. The top five show, and the rest are counted below.
Reading it well
- Compare ranges before drawing conclusions. A quiet day inside a busy week is normal. Switch to Week or Month before deciding a project has stalled.
- Check who's building against your plan. If you asked Ratchet to build the data loader and Ratchet barely appears, open its chats to see what happened.
- Pair the numbers with the work. A large refactor and a one-line fix each count as an edit. Read the pages and results before judging a week.
- Watch opened against closed. Many issues opened and few closed can mean tasks are too big to finish in one go. Try splitting them.